

Abstract
IL-6 plays a fundamental role in T cell differentiation and is strictly controlled by surface expression and shedding of IL-6R. IL-6 also acts on other cells that might affect T cell maturation. To study the impact of cell-autonomous and uncontrolled IL-6 signaling in T cells, we generated mice with a constitutively active IL-6R gp130 chain (Lgp130) expressed either in all T cells (Lgp130 × CD4Cre mice) or inducible in CD4+ T cells (Lgp130 × CD4CreERT2 mice). Lgp130 × CD4Cre mice accumulated activated T cells, including TH17 cells, in the lung, resulting in severe inflammation. Tamoxifen treatment of Lgp130 × CD4CreERT2 mice caused Lgp130 expression in 40–50% of CD4+ T cells, but mice developed lung disease only after several months. Lgp130+ CD4+ T cells were also enriched for TH17 cells; however, there was concomitant expansion of Lgp130− regulatory T cells, which likely restricted pathologic Lgp130+ T cells. In vitro, constitutive gp130 signaling in T cells enhanced but was not sufficient for TH17 cell differentiation. Augmented TH17 cell development of Lgp130+ T cells was also observed in Lgp130 × CD4CreERT2 mice infected with Staphylococcus aureus, but gp130 activation did not interfere with formation of TH1 cells against Listeria monocytogenes. Lgp130+ CD4+ T cells acquired a memory T cell phenotype and persisted in high numbers as a polyclonal T cell population in lymphoid and peripheral tissues, but we did not observe T cell lymphoma formation. In conclusion, cell-autonomous gp130 signaling alters T cell differentiation. Although gp130 signaling is not sufficient for TH17 cell differentiation, it still promotes accumulation of activated T cells in the lung that cause tissue inflammation.
This article is featured in Top Reads, p.1625
Introduction
The cytokine IL-6 is produced by a large number of immune cells. IL-6 binds to IL-6Rα (CD126) and this complex interacts with and induces dimerization of gp130 (CD130), the signal-transducing subunit of the IL-6 receptor (1). Dimerization of gp130 activates the MAPK pathway as well as tyrosine kinases of the JAK family, which phosphorylate STAT3 and STAT1. Upon phosphorylation, the STAT proteins dimerize and translocate to the nucleus where they initiate specific transcriptional programs (2). gp130 is ubiquitously expressed and also part of receptor complexes for other members of the IL-6 cytokine family, including IL-11, IL-27, oncostatin M, ciliary neurotrophic factor, cardiotrophin-1, LIF, and cardiotrophin-like cytokine (1). In contrast to the ubiquitously expressed gp130, expression of IL-6Rα is limited to immune cells, hepatocytes, and some epithelial cells. Naive T cells and different memory T cell subsets express IL-6Rα; however, upon activation, T cells rapidly shed IL-6Rα from the surface by limited proteolysis, generating a soluble IL-6Rα. Soluble IL-6Rα still binds IL-6 and this complex can interact with membrane-bound gp130 and induce gp130 signaling. This so-called IL-6 trans-signaling allows IL-6 stimulation of gp130+ cells independent from IL-6Rα surface expression and thereby expands the spectrum of IL-6 responsive cells and also enables IL-6 stimulation of IL-6Rα− T cells (1, 3). In addition, in a process called IL-6 trans-presentation, dendritic cells use IL-6/IL-6Rα complexes on their surface to activate gp130 on T cells (4).
T cell stimulation in the presence of multiple cytokine combinations, particularly of IL-6, IL-23, and TGF-β or of IL-6, IL-23, and IL-1β, causes maturation of naive CD4+ T cells to TH17 cells, which differ in effector phenotype and function (5). The JAK-STAT3 pathway activated by IL-6, but also by IL-23 and IL-21, is central in this process and induces expression of the TH17 lineage-defining transcription factors retinoic acid–related orphan receptor (ROR)γt and RORα. TH17 cells are characterized by the secretion of IL-17A, IL-17F, and IL-22 and are mainly found in mucosal sites and skin where they provide host defense against extracellular bacteria and fungi, but are also associated with autoimmune diseases (2, 5, 6).
gp130 activation induces proteins of the suppressor of cytokine signaling (SOCS) family and of the cytokine-inducible SH2 domain–containing (CIS) family inhibitors that limit gp130 signaling (2). Mice with hyperreactive gp130 due to a point mutation deleting its SOCS3 binding site display hematopoietic abnormalities, including splenomegaly, lymphadenopathy, and thrombocytosis, as well as enhanced acute phase response and spontaneous formation of gastric adenomas (7–9). These mice also develop arthritis at old age and are more susceptible in a model of induced arthritis; however, arthritis development appears to be independent from IL-17A (10, 11). Recently, we and others developed mouse lines transgenic for a constitutively active IL-6R gp130 chain (Lgp130) in which the extracellular domains are replaced by a leucine zipper resulting in constitutive dimerization and ligand-independent activation (12–14). Hepatocyte-restricted Lgp130 expression causes permanent production of acute phase proteins. As a consequence, mice show enhanced accumulation of myeloid cells in the liver and improved innate control of bacterial infection (14). Lgp130 expression in all B cells results in formation of B cell lymphomas and of CD138+ plasmacytomas. Similar B cell malignancies, although with different kinetics, are also observed when Lgp130 is activated in germinal center B cells or during plasma cell development, as well as after Lgp130 induction in all hematopoietic cells (13). Overall, these studies indicate that uncontrolled cell-autonomous gp130 activity and accordingly IL-6 signaling result in disturbed function of hematopoietic cells with chronic inflammation and B cell tumors as a potential outcome.
In this study, we investigated the consequences of constitutive and cell-autonomous gp130 signaling in T cells for their differentiation and function in vitro and in vivo and for the development of T cell lymphomas. We generated Lgp130 × CD4Cre mice with expression of the constitutive active Lgp130 in all conventional CD4+ and CD8+ T cells, and Lgp130 × CD4CreERT2 mice with tamoxifen-inducible Lgp130 expression in CD4+ T cells. Using CD4+ T cells from these mice, we determined the impact of gp130 signaling on T cell differentiation under defined in vitro conditions. In these mouse strains, we analyzed the effect of Lgp130 expression on the T cell differentiation status under homeostatic conditions and following bacterial infection, as well as the short- and long-term consequences for the immune system of the mice.
Materials and Methods
Mice
R26lgp130/lgp130 (Lgp130) mice (14), B6.Cg-Tg(Cd4-cre)1Cwi/BfluJ mice (CD4Cre, The Jackson Laboratory, stock no. 022071) (15), and CD4-CreERT2 mice (16) were on a C57BL/6 background. R26lgp130/wt::CD4Cre (Lgp130 × CD4Cre) mice and R26lgp130/wt::CD4-CreERT2 (Lgp130 × CD4CreERT2) mice were F1 animals of intercrosses of the parental lines. Age- and sex-matched mice of both sexes were used. Lgp130 × CD4CreERT2 mice were injected i.p. with 2 mg/day tamoxifen (Merck, Mannheim, Germany) in 100 µl of corn oil (Sigma-Aldrich, St. Louis, MO) at 5 consecutive days to induce Cre-recombinase–based induction of Lgp130 expression in CD4+ cells. Tamoxifen-injected R26lgp130/wt mice and corn oil–injected Lgp130 × CD4CreERT2 mice served as controls. Genotyping of mice was done by conventional PCR on genomic DNA as described before (14).
Animal experiments were performed in accordance with the German Animal Protection Law and were approved by the Behörde für Justiz und Verbraucherschutz of the city of Hamburg (protocol N091/2019). Mice were housed under specific pathogen-free conditions in individually ventilated cages with standard food and water ad libitum. Both male and female mice were included in this study.
Staphylococcus aureus infection
Mice were infected with S. aureus strain SH1000 (17, 18). Mice received 1–5 × 10⁷ CFU in 100 µl of PBS via the tail vein. The inoculum was controlled by serially diluting and plating on Luria–Bertani (LB) agar plates. Bacterial titers of kidney and spleen were quantified at 7 d postinfection by serial dilutions of homogenized organs in sterile PBS. Serial dilutions of organ suspensions were plated on LB agar and plates were incubated overnight at 37°C.
Listeria monocytogenes infection
Mice were i.p. infected with an L. monocytogenes strain recombinant for OVA (LmOVA) (19). The mice received 1 × 10⁴ CFU in 100 µl of sterile PBS. The inoculum was controlled by plating a serial dilution on LB agar plates. FACS analysis was performed 8 d after the infection.
Colonoscopy
Colonoscopy was performed in a blinded fashion using the Coloview system (Karl Storz, Tuttlingen, Germany) as previously described (20). Colitis scoring was based on granularity of mucosal surface, stool consistency, vascular pattern, translucency of the colon, and fibrin visible (0–3 points for each, maximum score of 12).
Bronchoalveolar lavage and lactate dehydrogenase measurement
Mice were euthanized and the neck was dissected to expose the trachea. A syringe catheter was used to cannulate the trachea and lavage the lungs with 1 ml of PBS/3% FBS. The lavage was repeated three times for a total of 3 ml of bronchoalveolar lavage fluid. Recovered lavage fluid was centrifuged at 300 × g for 10 min. Lactate dehydrogenase in supernatants was measured using the LDHI2 kit and the cobas Integra 400 Plus reader (Roche Diagnostics, Rotkreuz, Switzerland).
Histology
Lung, liver, kidney, spleen, and intestine were formalin fixed and paraffin embedded. Samples were cut by a microtome to a thickness of 2 µm. After deparaffinization, tissues were stained with H&E. The samples were examined under the Axio Imager.A2 (Zeiss, Oberkochen, Germany).
Isolation of cells from animal tissues
To distinguish cells within tissues from cells in blood vessels, intravascular leukocytes were stained by i.v. injection of fluorochrome-conjugated anti-CD45 mAb (clone 30-F11, 2.5 µg/mouse) 3 min before sacrificing (21). Spleens were pressed through 70- and 40-µm cell strainers to isolate the cells. Kidney, lung, and liver were digested for 40 min at 37°C in 5 ml of RPMI 1640 with 10 U/ml DNase I (Sigma-Aldrich, St. Louis, MO) and 400 µg/ml collagenase D (Roche, Mannheim, Germany). Then, leukocytes were isolated by density gradient centrifugation (40% Percoll [GE Healthcare, Chicago, IL]). The leukocytes were additionally filtered through a 30-µm strainer. Erythrocytes were depleted using lysis buffer (155 mM NH4Cl, 10 mM KHCO3, 10 µM EDTA [pH 7.2]).
Isolation of leukocytes from the large intestine was done as described previously (22). Briefly, colon and cecum were cut into small pieces and incubated at 37°C for 20 min in DTE medium (10% ml of 10× HBSS, 10% 10× HEPES-bicarbonate buffer, 10% ml of heat-inactivated FCS and 1 mM dithioerythritol [Roche, Mannheim, Germany]). Cells in the supernatant were collected by centrifugation. Remaining tissue was digested for 45 min at 37°C with 400 µg/ml collagenase D (Roche, Mannheim, Germany), 10 U/ml DNase I (Sigma-Aldrich, St. Louis, MO) in RPMI 1640 supplemented with penicillin, streptomycin, and gentamicin. After the digestion, the cell suspension was passed through a strainer. Cells were washed and pooled with cells collected from the supernatant. Lymphocytes were further enriched by density gradient centrifugation (40 and 70% Percoll [GE Healthcare, Chicago, IL]) and washed with PBS/0.2% BSA.
Ab staining and flow cytometry
Unspecific Ab staining via the Fc receptor was prevented by incubating leukocytes with 10 µg/ml anti-CD16/32 mAb (clone 2.4G2; Bio X Cell, West Lebanon, NH) and 1:100 rat serum in PBS for 5 min. Surface proteins were stained with mAbs and live/dead stain (Pacific Orange succinimidyl ester [PacO; Life Technologies, Darmstadt, Germany] or Alexa Fluor 750 carboxylic acid, succinimidyl ester [Thermo Fisher Scientific, Waltham, MA]). The cells were fixed and permeabilized using the Foxp3 transcription factor staining kit (eBioscience, San Diego, CA) according to the manufacturer’s protocol. After 5 min, fluorochrome-conjugated mAbs were added. After a further 20 min on ice, cells were washed with PBS.
For analysis of cytokine production via flow cytometry, cells were cultured for 4 h in IMDM supplemented with 5% FCS, l-glutamine, pyruvate, gentamicin, and 2-ME. Cells were stimulated with PMA (50 ng/ml, Sigma Aldrich) and ionomycin (1 μM, Sigma-Aldrich) or with 10−5 M listeriolysin O (LLO) peptide aa 189–201 (LLO189 − 201, WNEKYAQAYPNVS, JPT, Berlin, Germany). Then, 10 µg/ml brefeldin A (Sigma-Aldrich, St. Louis, MO) was added to prevent cytokine secretion. For p-STAT3 induction, cells were cultured for 30 min in prewarmed IMDM medium with 10 ng/ml mouse (m)IL-6 (BioLegend, San Diego, CA).
Fluorochrome-conjugated mAb against CD3ε (clones 145-2C11, 500A2), CD4 (RM4-5), CD8 (53-6.7), CD11b (M1/70), CD19 (eBio1D3), CD44 (IM7), CD45 (30-F11), CD69 (H1.2F3), CD154 (MR1), Foxp3 (FJK-16s), IFN-γ (XMG1.2), IL-17A (TC1118H10.1), IL-22 (Poly5164), Ki-67 (B56, SolA15), Ly6C (HK1.4), Ly6G (1A8), RORγt (Q31-378), p-STAT3 (47P-STAT3), γδ-TCR (GL3), Vβ2-TCR (B20.6), Vβ3-TCR (KJ25), Vβ4-TCR (KT4), Vβ5.1-TCR (MR9-4), Vβ6-TCR (RR4-7), Vβ7-TCR (TR310), Vβ8.1/8.2-TCR (KJ16-133), Vβ8.3-TCR (8C1), Vβ9-TCR (MR10-2), Vβ10-TCR (8.48), Vβ11-TCR (KT11), Vβ12-TCR (MR11-1), Vβ13-TCR (MR12-3), and Vβ14-TCR (14-2) were purchased from BD Biosciences, eBioscience, or BioLegend.
For flow cytometric analysis, a FACSCanto II and FACSCelesta (both by BD Biosciences, San Jose, CA) were used. Data were analyzed with FlowJo v10.8.1 (Becton Dickinson, Franklin Lakes, NJ).
In vitro differentiation of CD4+ T cells
Lymphocytes were isolated from spleens of Lgp130 × CD4CreERT2 mice 18 and 35 d after the final tamoxifen treatment. Naive CD4+CD25−CD44− T cells were isolated by depletion of all CD25+ and CD44+ T cells, followed by enrichment of CD4+ T cells using MACS according to the manufacturer’s instructions (Miltenyi Biotec, Bergisch-Gladbach, Germany). The purity of CD4+ T cells was determined by flow cytometry and was on average 80%. We did not separate ZsGreen+ and ZsGreen− CD4+ T cells. Thus, cultures contained both T cell populations (usually at a ratio of ∼1:1), which allowed comparison of differentiation under identical conditions. The cells were cultured in 96-well plates at 2 × 10⁵ cells per well in 200 µl of full Click’s medium (Irvine Scientific, Santa Ana, CA) supplemented with cytokines and Abs for distinct differentiation conditions. Cells in all conditions were cultured in plates coated with 10 µg/ml anti-CD3ɛ mAb (clone 145 2C1). For TH1 cell differentiation, naive CD4+ T cells were cultured with 100 U/ml mIL-2, 10 ng/ml mIL-12, 10 µg/ml anti–IL-4 mAb (clone 11B11), and 2 µg/ml anti-CD28 mAb (clone 37.51). For the TH17 cell differentiation, cells were cultured with 10 ng/ml mIL-6, 0.25 ng/ml human TGF-β1, 10 µg/ml anti-IL-4 mAb, 10 µg/ml anti–IFN-γ mAb (clone XMG1.2), and 2 µg/ml anti-CD28 mAb. For the differentiation of regulatory T (Treg) cells, cells were cultured with 50 U/ml mIL-2, 2 ng/ml human TGF-β1, and 2 µg/ml anti-CD28 mAb. For TH0 cell differentiation, cells were cultured with 2 µg/ml anti-CD28 mAb and 100 U/ml mIL-2. All cytokines and Abs were purchased from BioLegend (San Diego, CA) and Miltenyi Biotec. Three to 4 d after culture, T cells were restimulated with PMA (50 ng/ml [Sigma-Aldrich]) and ionomycin (1 µM [Sigma-Aldrich]) for 4 h. The expression of cytokines and Foxp3 was determined by intracellular Ab staining.
Statistical analysis
All statistical analysis was performed using GraphPad Prism 9 (GraphPad Software, San Diego, CA), and results were analyzed by the statistical tests indicated in the figure legends (p values are denoted as *p < 0.05, **p < 0.01, ***p < 0.001, and ****p < 0.0001).
Results
Expression of constitutive active Lgp130 in T cells causes severe lung inflammation and early death of mice
To investigate the influence of gp130 signaling on T cells, we generated Lgp130 × CD4Cre mice by breeding Lgp130 mice (14) to CD4Cre mice. Lgp130 is an engineered, constitutively active gp130 variant in which the extracellular domains have been replaced by a leucine zipper, resulting in constitutive and ligand-independent activation. In Lgp130 transgenic mice, an expression cassette coding for Lgp130, a 2A peptide, and a ZsGreen reporter under the control of a constitutive promotor and a floxed stop cassette was inserted into the ROSA26 locus (Supplemental Fig. 1A). In F1 Lgp130 × CD4Cre mice, Cre-mediated deletion causes excision of the stop cassette and constitutive expression of Lgp130 in CD4+ T cells. Due to the strong Cd4 expression in double-positive thymocytes, excision also occurs in CD8+ T cells. In both CD4+ and CD8+ T cells of Lgp130 × CD4Cre mice, we consistently observed ZsGreen expression in >90% of cells (Fig. 1A, gating strategies in Supplemental Fig. 1B). ZsGreen expression was not detected in B cells or dendritic cells of Lgp130 × CD4Cre mice or in T cells from Lgp130 mice.
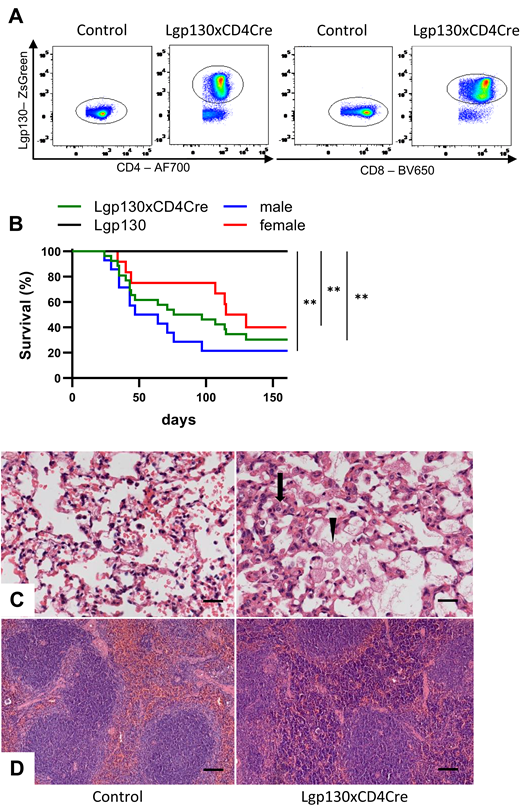
Constitutively active Lgp130 in T cells causes lung inflammation and early death of mice. (A) Representative ZsGreen fluorescence of CD4+ and CD8+ T cells from spleens of Lgp130 control and Lgp130 × CD4Cre mice. (B) Survival of control (Lgp130) mice (n = 8), Lgp130 × CD4Cre mice (n = 27, median survival 97 d), and male (n = 15, median survival 64 d) or female (n = 12, median survival 123 d) Lgp130 × CD4Cre mice. **p < 0.01. (C and D) Sections from lung and spleen from 12-wk-old Lgp130 control and Lgp130 × CD4Cre mice were stained with H&E. (C) Representative sections of lungs reveal thickened alveolar walls (arrow), mononuclear cell infiltration, and foam cells in alveoli (arrowhead) of Lgp130 × CD4Cre mice. Scale bars, 20 µm. (D) Representative sections of spleens show lymphocyte accumulation in the red pulp of Lgp130 × CD4Cre mice. Scale bars, 100 µm.
Constitutively active Lgp130 in T cells causes lung inflammation and early death of mice. (A) Representative ZsGreen fluorescence of CD4+ and CD8+ T cells from spleens of Lgp130 control and Lgp130 × CD4Cre mice. (B) Survival of control (Lgp130) mice (n = 8), Lgp130 × CD4Cre mice (n = 27, median survival 97 d), and male (n = 15, median survival 64 d) or female (n = 12, median survival 123 d) Lgp130 × CD4Cre mice. **p < 0.01. (C and D) Sections from lung and spleen from 12-wk-old Lgp130 control and Lgp130 × CD4Cre mice were stained with H&E. (C) Representative sections of lungs reveal thickened alveolar walls (arrow), mononuclear cell infiltration, and foam cells in alveoli (arrowhead) of Lgp130 × CD4Cre mice. Scale bars, 20 µm. (D) Representative sections of spleens show lymphocyte accumulation in the red pulp of Lgp130 × CD4Cre mice. Scale bars, 100 µm.
Lgp130 × CD4Cre mice were smaller in size than Lgp130 mice and at ∼4 wk, mice started to show reduced general health conditions. Mice had significantly lower body weight at 9 wk (Lgp130 × CD4Cre, 19.2 ± 1.4 g; Lgp130, 25.7 ± 2.4 g [p < 0.0001, n = 7, representative data of one out of three experiments]). Due to critical health status, Lgp130 × CD4Cre mice had to be killed starting after 5 wk. Overall, we observed a mean survival time of ∼100 d. Male mice appeared to be slightly more susceptible than female mice (Fig. 1B). Analysis of Lgp130 × CD4Cre mice at 12 wk revealed pale internal organs and an enlarged spleen. Histological inspection showed profound inflammation of the lung in 14 out of 14 analyzed Lgp130 × CD4Cre mice but none in 8 age-matched controls. We observed thickened and hypercellular alveolar walls, sporadically with a hyaline appearance. Lungs showed focal perivascular and peribronchial mononuclear cell infiltration resulting in marked reduction of alveolar space (Fig. 1C). Additionally, macrophages with a foamy appearance were frequently detected in the alveolar space. Morphological changes were associated with a slight increase in the lactate dehydrogenase concentrations in the bronchoalveolar lavage (Lgp130 × CD4Cre, 123.3 ± 23.6 U/l [n = 5]; Lgp130, 69.4 ± 8.4 U/l [n = 5]; p = 0.063). The structure of the spleen was maintained with clearly separated white and red pulp areas; however, mice showed accumulation of lymphocytes in the red pulp (Fig. 1D). Mononuclear cell infiltration was also found in kidney and liver, with moderate cell accumulation in the interstitial and periglomerular space and mild accumulation around the Glisson triad, respectively (Supplemental Fig. 1C, 1D). Neither histologic inspection nor colonoscopy revealed signs of inflammation in the intestine of Lgp130 × CD4Cre mice (Supplemental Fig. 1E, 1F).
Expression of constitutively active Lgp130 in T cells results in an altered T cell phenotype
We observed a >10-fold increase in the numbers of CD4+ and CD8+ T cells in lungs of Lgp130 × CD4Cre mice compared with Lgp130 control mice (Supplemental Fig. 2A). In contrast, Lgp130 × CD4Cre mice had similar or only slightly increased numbers of CD4+ T cells and CD8+ T cells in spleen and large intestine when compared with Lgp130 control mice. Higher numbers of neutrophils and Ly6Chigh inflammatory monocytes were also observed in spleens and lungs of Lgp130 × CD4Cre mice (Supplemental Fig. 2B–D). Phenotypic characterization of CD4+ and CD8+ T cells revealed increased frequencies of CD44+ Ag-experienced and Ki-67+ proliferating CD4+ T cells in all three organs of Lgp130 × CD4Cre mice (Supplemental Fig. 2E, 2F). Overall, these result indicate that Lgp130 × CD4Cre mice showed a marked accumulation of activated CD4+ and CD8+ T cells, particularly in the lung.
IL-6 and thus gp130 signaling plays a central role in TH cell differentiation, especially in the TH17 cell lineage. Compared to Lgp130 mice, Lgp130 × CD4Cre mice showed a profound increase of RORγt+ TH17 cells in all tissues with up to 40 and 20% positive cells in intestine and lung, respectively (Supplemental Fig. 2G, 2I). In contrast, there was a reduction in percentages of Foxp3+ Treg cells in intestine and lung, but not in the spleen (Supplemental Fig. 2H, 2J). Thus, constitutive T cell–intrinsic gp130 signaling caused profound alterations in the CD4+ T cell composition.
Inducible Lgp130 alters phenotype and differentiation of CD4+ T cells
Because the severe phenotype of Lgp130 × CD4Cre mice restricted the functional analysis of Lgp130+ T cells, we generated Lgp130 × CD4CreERT2 mice (F1 of Lgp130 and CD4CreERT2 mice), in which Lgp130 expression can be induced in CD4+ cells by tamoxifen treatment. Mice were treated on 5 successive days with tamoxifen and analyzed 10 and 30 d after the last treatment. At both time points, we detected ∼40% and 50% of ZsGreen+ CD4+ T cells in spleen and lung, respectively (Fig. 2A). Only ∼5% of CD8+ T cells were ZsGreen+ and most likely represent descendants of double-positive thymocytes at the time point of treatment. All other tested leukocytes were ZsGreen−. Intracellular staining for p-STAT3 revealed phosphorylation of STAT3 in ZsGreen+ CD4+ T cells, confirming the constitutive activity of Lgp130 (Supplemental Fig. 3A). At day 10 posttreatment, ZsGreen+ CD4+ T cells, ZsGreen− CD4+ T cells, and CD4+ T cells from control mice showed similar percentages of CD44+ cells; however, at day 30, we observed an expansion of CD44+ cells among ZsGreen+ CD4+ T cells in spleen and lung (Fig. 2B). ZsGreen+ CD4+ T cells expressed more Ki-67 than did control cells at day 10, but not at day 30 (Fig. 2C). Overall, ZsGreen+ CD4+ T cells in Lgp130 × CD4CreERT2 mice appeared to be less activated than those in Lgp130 × CD4Cre mice.
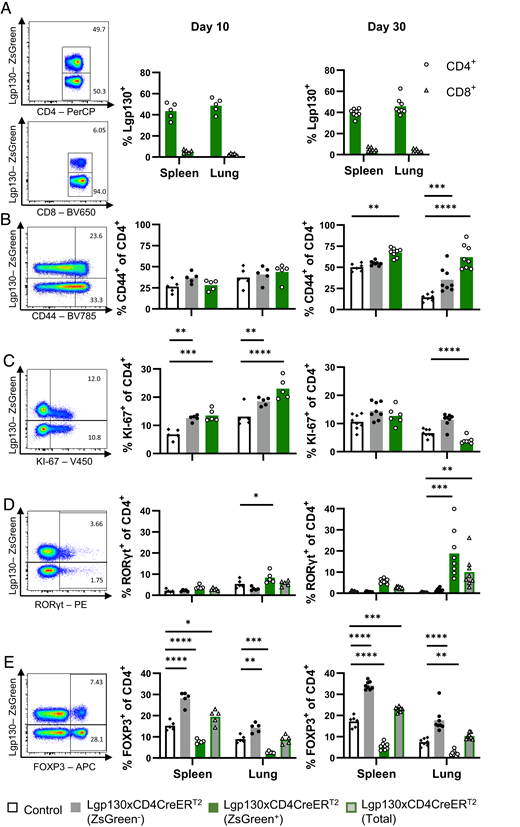
Inducible Lgp130 alters phenotype and differentiation status of CD4+ T cells. Lgp130 × CD4CreERT2 and Lgp130 control mice were treated with tamoxifen and analyzed 10 and 30 d after the last tamoxifen application. (A) Representative ZsGreen staining of CD4+ and CD8+ T cells from spleens of Lgp130 × CD4CreT2 mice and frequencies of ZsGreen+ CD4+ and CD8+ T cells at 10 and 30 d postinduction. (B–E) Representative FACS plots for CD4+ T cells from spleens of Lgp130 × CD4CreERT2 mice and percent CD44+ cells (B), percent Ki-67+ cells (C), percent RORγt+ cells (D), and percent Foxp3+ cells (E) in ZsGreen+ or ZsGreen− CD4+ T cell populations isolated from spleens and lungs of mice at 10 and 30 d postinduction. The percent values given in the FACS plots were calculated for either the ZsGreen+ or ZsGreen− CD4+ T cells. White bars indicate CD4+ T cells of Lgp130 control mice (n = 5 at day 10, n = 7 at day 30). Gray bars indicate ZsGreen− CD4+ T cells, green bars indicate ZsGreen+ CD4+ T cells, and gray bars with green borders indicate all CD4+ T cells of Lgp130 × CD4CreERT2 mice (n = 5 at day 10, n = 8 at day 30). Data show results of one experiment and are representative of three and two individually performed experiments for days 10 and 30 postinduction, respectively. Bars represent the mean, and statistical analysis was done with a two-way ANOVA and Tukey’s posttest. *p < 0.05, **p < 0.01, ***p < 0.001, ****p < 0.0001.
Inducible Lgp130 alters phenotype and differentiation status of CD4+ T cells. Lgp130 × CD4CreERT2 and Lgp130 control mice were treated with tamoxifen and analyzed 10 and 30 d after the last tamoxifen application. (A) Representative ZsGreen staining of CD4+ and CD8+ T cells from spleens of Lgp130 × CD4CreT2 mice and frequencies of ZsGreen+ CD4+ and CD8+ T cells at 10 and 30 d postinduction. (B–E) Representative FACS plots for CD4+ T cells from spleens of Lgp130 × CD4CreERT2 mice and percent CD44+ cells (B), percent Ki-67+ cells (C), percent RORγt+ cells (D), and percent Foxp3+ cells (E) in ZsGreen+ or ZsGreen− CD4+ T cell populations isolated from spleens and lungs of mice at 10 and 30 d postinduction. The percent values given in the FACS plots were calculated for either the ZsGreen+ or ZsGreen− CD4+ T cells. White bars indicate CD4+ T cells of Lgp130 control mice (n = 5 at day 10, n = 7 at day 30). Gray bars indicate ZsGreen− CD4+ T cells, green bars indicate ZsGreen+ CD4+ T cells, and gray bars with green borders indicate all CD4+ T cells of Lgp130 × CD4CreERT2 mice (n = 5 at day 10, n = 8 at day 30). Data show results of one experiment and are representative of three and two individually performed experiments for days 10 and 30 postinduction, respectively. Bars represent the mean, and statistical analysis was done with a two-way ANOVA and Tukey’s posttest. *p < 0.05, **p < 0.01, ***p < 0.001, ****p < 0.0001.
After 10 d, there was already an increase in the percentage of RORγt+ ZsGreen+ CD4+ T cells in the lung, which was significantly more pronounced at day 30 (Fig. 2D). In contrast, particularly in the lung only a few ZsGreen+ CD4+ T cells were Foxp3+ (Fig. 2E). However, we observed a strong increase in Foxp3+ T cells in the ZsGreen− CD4+ T cells of Lgp130 × CD4CreERT2 mice. When the total frequency of Foxp3+ CD4+ T cells was calculated, the accumulation of Foxp3+ ZsGreen− CD4+ T cells resulted in a net increase in Foxp3+ T cells in spleens of Lgp130 × CD4CreERT2 mice compared with spleens of control animals.
ZsGreen+ and control CD4+ T cells from spleens showed comparable upregulation of CD154, and similar percentages of T cells produced IFN-γ, but there was a significant increase in frequencies of IL-17A+ and IL-22+ ZsGreen+ CD4+ T cells (Supplemental Fig. 3B–E). Of note, there was no cytokine production of ZsGreen+ T cells in the absence of stimulation. Overall, Lgp130 × CD4CreERT2 mice also showed an accumulation of TH17 cells, which were likely restrained by a concomitant expansion of the ZsGreen− Foxp3+ CD4+ T cell population.
Lgp130 expression promotes TH17 cell differentiation in vitro
To directly analyze the role of gp130 signaling in T cell differentiation, Lgp130 × CD4CreERT2 mice were treated with tamoxifen and naive CD4+ T cells were purified and stimulated in vitro under defined polarizing conditions for TH0, TH1, TH17, and Treg cells. After 3 or 4 d, T cells were restimulated and the cytokine and Foxp3 expression profile was determined. Restimulation induced expression of CD154 in ∼80% of all TH cell subsets independent from their ZsGreen/Lgp130 expression, indicating that Lgp130 expression did not interfere with T cell activation (Fig. 3A). IFN-γ was induced under TH0 and particularly under TH1 conditions, and was reduced in ZsGreen+ cells (Fig. 3B). TH17 conditions resulted in IL-17A production by CD4+ T cells and production was enhanced in ZsGreen+ cells (Fig. 3C). However, Lgp130 expression only marginally increased frequencies of IL-17A+ cells under TH0 or TH1 polarizing conditions, and thus gp130 activation alone was not sufficient for TH17 cell induction. Interestingly, we did observe 5% of IL-17A+ ZsGreen+ cells under Treg cell conditions. Significant Foxp3 expression was only observed under Treg cell conditions and was reduced in ZsGreen+ cells (Fig. 3D). IL-22 was only marginally expressed under all culture conditions; however, we observed slightly higher expression in ZsGreen+ cells under TH17 and Treg cell conditions (Fig. 3E). In summary, under defined conditions Lgp130 enhanced IL-17A induction under TH17 conditions and reduced Foxp3 expression under Treg cell conditions. However, Lgp130 alone was not sufficient to drive TH17 cell differentiation of naive cells.

Lgp130 expression supports TH17 cell differentiation in vitro. Lgp130 × CD4CreERT2 mice were treated with tamoxifen. At 10 d postinduction, naive CD4+ T cells were purified from the spleen and incubated without separation of ZsGreen+ and ZsGreen− T cells under TH0, TH1, TH17, and Treg cell–inducing conditions (indicated on the x-axis). (A–E) After 3 or 4 d, cells were restimulated with PMA and ionomycin and expression of CD154 (A), IFN-γ (B), IL-17A (C), Foxp3 (D), and IL-22 (E) was determined by flow cytometry in ZsGreen− and ZsGreen+ CD4+ T cells. Representative results of three to four replicate cultures from one of three independent experiments are shown. Results were analyzed with a Mann–Whitney U test. *p < 0.05.
Lgp130 expression supports TH17 cell differentiation in vitro. Lgp130 × CD4CreERT2 mice were treated with tamoxifen. At 10 d postinduction, naive CD4+ T cells were purified from the spleen and incubated without separation of ZsGreen+ and ZsGreen− T cells under TH0, TH1, TH17, and Treg cell–inducing conditions (indicated on the x-axis). (A–E) After 3 or 4 d, cells were restimulated with PMA and ionomycin and expression of CD154 (A), IFN-γ (B), IL-17A (C), Foxp3 (D), and IL-22 (E) was determined by flow cytometry in ZsGreen− and ZsGreen+ CD4+ T cells. Representative results of three to four replicate cultures from one of three independent experiments are shown. Results were analyzed with a Mann–Whitney U test. *p < 0.05.
Lgp130 expression amplifies the TH17 cell response to S. aureus infection
S. aureus infection induces strong TH1 and TH17 cell responses, and particularly TH17 cells are required for the control of the pathogen (23). To test whether Lgp130 expression alters the TH1 and TH17 cell response during infection, Lgp130 × CD4CreERT2 mice were treated with tamoxifen and after 4–5 d infected i.v. with S. aureus. After 7 d, mice were analyzed for bacterial load in spleen and in kidney, a main target for S. aureus following systemic infection, and after 10 d FACS analysis was performed (18, 23). Compared to control mice, Lgp130 × CD4CreERT2 mice had similar S. aureus numbers in spleen and kidney (Fig. 4A). In infected Lgp130 × CD4CreERT2 mice, 40–60% of CD4+ T cells were ZsGreen+ with higher percentages in the kidney (Fig. 4B). Phenotypical characterization revealed upregulation of Ki-67 expression in ZsGreen+ cells (Fig. 4C). Foxp3+ expression was substantially reduced in ZsGreen+ cells in the spleen and almost absent in those cells in the kidney (Fig. 4D). As expected, infection resulted in accumulation of RORγt+ TH17 cells in the kidney, which was significantly enhanced for ZsGreen+ cells (Fig. 4E). In line with the larger RORγt+ T cell population, enhanced numbers of renal ZsGreen+ T cells also produced IL-17A or IL-22 (Fig. 4F, 4G). Interestingly, there was also an increase in the frequencies of IFN-γ+ cells in the renal ZsGreen+ T cell population including a substantial population of cells expressing both IL-17A and IFN-γ (Fig. 4H, 4I). In conclusion, Lgp130 expression enhanced the TH17 cell response to S. aureus infection and the formation of IL-17A and IFN-γ double-positive CD4+ T cells.

Lgp130 expression promotes TH17 cell differentiation in vivo. Lgp130 × CD4CreERT2 and Lgp130 control mice were treated with tamoxifen. Four or 5 d postinduction, mice were i.v. infected with S. aureus. Numbers of CFU were determined at 7 d postinduction and FACS analysis was performed at 10 d postinfection. (A) Numbers of CFU of S. aureus in spleen and kidney of infected Lgp130 × CD4CreERT2 (n = 8) and Lgp130 control mice (n = 8) (limit of detection of 10). Statistical analysis was done with a Mann–Whitney U test. (B) Frequencies of ZsGreen+ CD4+ T cells in spleen and kidney. (C–E) Expression of Ki-67 (C), Foxp3 (D), and RORγt (E) in ZsGreen− and ZsGreen+ CD4+ T cells from spleen and kidney. (F–I) Cells purified from spleen and kidney were polyclonally stimulated with PMA and ionomycin. Spleen cells were in addition cultured without stimulation (spleen −). Frequencies of IL-17A+CD154+ (F), IL-22+CD154+ (G), IFN-γ+CD154+ (H), and IL-17A+IFN-γ+CD154+ cells (I) of ZsGreen− and ZsGreen+ CD4+ T cells were determined by flow cytometry. In (B)–(I), results are shown of one representative experiment with seven Lgp130 × CD4CreERT2 mice out of four experiments. Statistical analysis was done with a paired t test. *p < 0.05, **p < 0.01, ***p < 0.001, ****p < 0.0001.
Lgp130 expression promotes TH17 cell differentiation in vivo. Lgp130 × CD4CreERT2 and Lgp130 control mice were treated with tamoxifen. Four or 5 d postinduction, mice were i.v. infected with S. aureus. Numbers of CFU were determined at 7 d postinduction and FACS analysis was performed at 10 d postinfection. (A) Numbers of CFU of S. aureus in spleen and kidney of infected Lgp130 × CD4CreERT2 (n = 8) and Lgp130 control mice (n = 8) (limit of detection of 10). Statistical analysis was done with a Mann–Whitney U test. (B) Frequencies of ZsGreen+ CD4+ T cells in spleen and kidney. (C–E) Expression of Ki-67 (C), Foxp3 (D), and RORγt (E) in ZsGreen− and ZsGreen+ CD4+ T cells from spleen and kidney. (F–I) Cells purified from spleen and kidney were polyclonally stimulated with PMA and ionomycin. Spleen cells were in addition cultured without stimulation (spleen −). Frequencies of IL-17A+CD154+ (F), IL-22+CD154+ (G), IFN-γ+CD154+ (H), and IL-17A+IFN-γ+CD154+ cells (I) of ZsGreen− and ZsGreen+ CD4+ T cells were determined by flow cytometry. In (B)–(I), results are shown of one representative experiment with seven Lgp130 × CD4CreERT2 mice out of four experiments. Statistical analysis was done with a paired t test. *p < 0.05, **p < 0.01, ***p < 0.001, ****p < 0.0001.
Lgp130 does not suppresses TH1 cell responses in vivo
To test the consequence of Lgp130 on the induction of TH1 cells in vivo, Lgp130 × CD4CreERT2 mice and Lgp130 control mice were treated with tamoxifen and subsequently infected with L. monocytogenes, which induces and is controlled by TH1 cells (24). After 8 d, polyclonal stimulation of spleen cells with PMA/ionomycin revealed similar frequencies of IFN-γ+ cells in ZsGreen+ and ZsGreen− CD4+ T cells from Lgp130 × CD4CreERT2 mice and in CD4+ T cells from control mice (Fig. 5A). Similar to noninfected mice, ZsGreen+ T cells from infected mice contained enlarged populations of IL-17A+ and IL-22+ cells (Fig. 5B, 5C). Stimulation of cells with the immune-dominant LLO peptide LLO198 − 201 allowed the detection of CD4+ T cells that were activated and expanded in response to L. monocytogenes infection (24). In control mice, LLO198 − 201 induced IFN-γ production in ∼0.5% of CD4+ T cells (Fig. 5D). ZsGreen+ and ZsGreen− CD4+ T cells from Lgp130 × CD4CreERT2 mice also contained ∼0.5% of IFN-γ+ cells, indicating that Lgp130 expression did not interfere with the induction of TH1 cells directed to L. monocytogenes. In all LLO298 − 201-specific CD4+ T cell populations, we detected only few IL-17A+ T cells; however, there was a small but significantly enlarged ZsGreen+ population that responded with IL-22 production to LLO189 − 201 (Fig. 5E, 5F). Overall, these results indicate that Lgp130 expression does not prevent the formation of TH1 cells in response to infection.

Lgp130 does not suppresses TH1 cell responses in vivo. Lgp130 × CD4CreERT2 and Lgp130 control mice were treated with tamoxifen. At 10 d postinduction, Lgp130 × CD4CreERT2 and Lgp130 control mice were i.v. infected with L. monocytogenes. (A–F) Eight days later, spleen cells were stimulated with PMA and ionomycin (A–C) or with LLO198 − 201 (D–F). CD154 expression and cytokine production of CD4+ T cells was determined by flow cytometry. White bars indicate CD4+ cells of Lgp130 control mice (n = 4). Gray and green bars indicate ZsGreen− and ZsGreen+ CD4+ T cells from Lgp130 × CD4CreERT2 mice (n = 5). The experiment was performed three times, and results of one representative experiment are shown. Statistical analysis was performed with a two-way ANOVA and Tukey’s posttest. *p < 0.05, **p < 0.01, ****p < 0.0001.
Lgp130 does not suppresses TH1 cell responses in vivo. Lgp130 × CD4CreERT2 and Lgp130 control mice were treated with tamoxifen. At 10 d postinduction, Lgp130 × CD4CreERT2 and Lgp130 control mice were i.v. infected with L. monocytogenes. (A–F) Eight days later, spleen cells were stimulated with PMA and ionomycin (A–C) or with LLO198 − 201 (D–F). CD154 expression and cytokine production of CD4+ T cells was determined by flow cytometry. White bars indicate CD4+ cells of Lgp130 control mice (n = 4). Gray and green bars indicate ZsGreen− and ZsGreen+ CD4+ T cells from Lgp130 × CD4CreERT2 mice (n = 5). The experiment was performed three times, and results of one representative experiment are shown. Statistical analysis was performed with a two-way ANOVA and Tukey’s posttest. *p < 0.05, **p < 0.01, ****p < 0.0001.
Lgp130+ cells cause severe lung inflammation in old Lgp130 × CD4CreERT2 mice
To test whether Lgp130 × CD4CreERT2 mice develop immunopathology after induction of Lgp130 expression, mice were treated with tamoxifen and monitored for up to 14 mo. For several months, mice appeared normal without behavioral impairments or signs of disease. After 9 mo, we observed signs of compromised lung function, such as orthopnea and wheezing, which deteriorated over time to a state where some animals had to be killed to prevent further suffering. Histologic analysis revealed extensive inflammation of the lungs with thickened alveolar walls and mononuclear cell infiltrations (Fig. 6A). We observed inflammatory changes in 12 out of 12 old Lgp130 × CD4CreERT2 mice and in 2 out of 12 age-matched control mice. Spleens showed focal resolution of the structure and lymphocyte infiltration into the red pulp area (Fig. 6B). Perivascular and periglomerular infiltrations of mononuclear cells were also detected in kidneys (Fig. 6C) and moderate perivascular infiltrations were found in the livers (Fig. 6D).

Lgp130+ cells cause severe lung inflammation in old Lgp130 × CD4CreERT2 mice. (A–D) Representative sections of lungs (A), spleens (B), kidneys (C), and livers (D) of 9- to 14-mo-old mice. H&E staining. Scale bars in lung, 20 µm; scale bars in spleen, kidney, and liver, 100 µm. Untreated Lgp130 × CD4CreERT2 mice or Lgp130 mice were used as controls. (E and F) Lgp130 × CD4CreERT2 mice were treated with tamoxifen, and CD4+ T cells in peripheral blood were tested for ZsGreen (E) and CD44 expression (F) at the indicated time points. Results for individual mice are shown (n = 6).
Lgp130+ cells cause severe lung inflammation in old Lgp130 × CD4CreERT2 mice. (A–D) Representative sections of lungs (A), spleens (B), kidneys (C), and livers (D) of 9- to 14-mo-old mice. H&E staining. Scale bars in lung, 20 µm; scale bars in spleen, kidney, and liver, 100 µm. Untreated Lgp130 × CD4CreERT2 mice or Lgp130 mice were used as controls. (E and F) Lgp130 × CD4CreERT2 mice were treated with tamoxifen, and CD4+ T cells in peripheral blood were tested for ZsGreen (E) and CD44 expression (F) at the indicated time points. Results for individual mice are shown (n = 6).
Lgp130+ T cells in Lgp130 × CD4CreERT2 mice acquire a memory phenotype with a strong TH17 cell bias
After tamoxifen treatment, frequencies of CD4+ T cells were repeatedly analyzed in peripheral blood (Fig. 6E). Over time, the percentage of ZsGreen+ CD4+ T cells steadily increased to levels of up to 60%. Within a few weeks, ZsGreen+ CD4+ T cells uniformly acquired a CD44+ phenotype whereas ZsGreen− T cells only slowly gained CD44+ expression, likely due to waning thymus function (Fig. 6F). Nine to 14 mo after tamoxifen treatment, 40–60% of CD4+ T cells in spleen, lung, kidney, liver, and colon were ZsGreen+ with particularly high frequencies in lung, consistent with the pronounced infiltration of this tissue (Fig. 7A). In all tissues, ZsGreen+ CD4+ T cells comprised similar or even larger populations of CD45iv−CD69+ T cells than ZsGreen− CD4+ T cells or CD4+ T cells of control mice, and thus Lgp130 expression did not interfere with the formation of tissue-resident T cells (Fig. 7B). Large populations of ZsGreen+ CD4+ cells in all tissues were RORγt+, resulting in substantial accumulation of total RORγt+ CD4+ T cells in tissues of Lgp130 × CD4CreERT2 mice when compared with tissues of control mice (Fig. 7C). Analysis of the cytokine profile in spleen and lung confirmed the accumulation of TH17 cells (Supplemental Fig. 4A). Particularly in the lung, we detected expanded populations of IL-17A+ and IL-22+ ZsGreen+ CD4+ T cells. In contrast to TH17 cells, frequencies of ZsGreen+ Foxp3+ T cells were reduced in the spleen and cells were almost absent in all other tissues. As observed in young mice, reduction of ZsGreen+ Foxp3+ T cells was coupled to an increase in frequencies of ZsGreen− Foxp3+ T cells (Fig. 7D).

Lgp130+ T cells in Lgp130 × CD4CreERT2 mice acquire a stable memory phenotype with a strong TH17 cell bias. Lgp130 × CD4CreERT2 mice were treated with tamoxifen. Lgp130 or untreated Lgp130 × CD4CreERT2 mice served as controls. Mice were analyzed 9–14 mo after treatment. (A) ZsGreen+ cells of CD4+ T cells in spleen, lung, kidney, liver, and colon of tamoxifen-treated Lgp130 × CD4CreERT2 mice. (B–D) CD44+CD69+CD4+ T cells (B), RORγt+CD4+ T cells (C), and Foxp3+CD4+ T cells (D) in tissues of tamoxifen-treated Lgp130 × CD4CreERT2 mice and control mice. White bars indicate CD4+ T cells of control mice (n = 11). Gray bars indicate ZsGreen− CD4+ T cells, green bars indicate ZsGreen+ CD4+ T cells, and gray bars with green borders indicate all CD4+ T cells of Lgp130 × CD4CreERT2 mice (n = 15). The experiments were performed three times and pooled results are shown in graphs. Statistical analysis was performed with a two-way ANOVA and Tukey’s posttest. (E) Mean values for TCR Vβ distribution of splenic CD4+ T cells from old control mice (n = 7) and of ZsGreen− CD4+ T cells from old tamoxifen-induced Lgp130 × CD4CreERT2 mice (n = 4). (F) TCR Vβ repertoires of splenic ZsGreen+ CD4+ T cells from individual old tamoxifen-induced Lgp130 × CD4CreERT2 mice. +, expanded Vβ+ populations. *p < 0.05, **p < 0.01, ***p < 0.001, ****p < 0.0001.
Lgp130+ T cells in Lgp130 × CD4CreERT2 mice acquire a stable memory phenotype with a strong TH17 cell bias. Lgp130 × CD4CreERT2 mice were treated with tamoxifen. Lgp130 or untreated Lgp130 × CD4CreERT2 mice served as controls. Mice were analyzed 9–14 mo after treatment. (A) ZsGreen+ cells of CD4+ T cells in spleen, lung, kidney, liver, and colon of tamoxifen-treated Lgp130 × CD4CreERT2 mice. (B–D) CD44+CD69+CD4+ T cells (B), RORγt+CD4+ T cells (C), and Foxp3+CD4+ T cells (D) in tissues of tamoxifen-treated Lgp130 × CD4CreERT2 mice and control mice. White bars indicate CD4+ T cells of control mice (n = 11). Gray bars indicate ZsGreen− CD4+ T cells, green bars indicate ZsGreen+ CD4+ T cells, and gray bars with green borders indicate all CD4+ T cells of Lgp130 × CD4CreERT2 mice (n = 15). The experiments were performed three times and pooled results are shown in graphs. Statistical analysis was performed with a two-way ANOVA and Tukey’s posttest. (E) Mean values for TCR Vβ distribution of splenic CD4+ T cells from old control mice (n = 7) and of ZsGreen− CD4+ T cells from old tamoxifen-induced Lgp130 × CD4CreERT2 mice (n = 4). (F) TCR Vβ repertoires of splenic ZsGreen+ CD4+ T cells from individual old tamoxifen-induced Lgp130 × CD4CreERT2 mice. +, expanded Vβ+ populations. *p < 0.05, **p < 0.01, ***p < 0.001, ****p < 0.0001.
Because ZsGreen+ CD4+ T cells developed into stable memory T cell populations, we tested whether these memory T cells were due to polyclonal precursors with a broad TCR repertoire or derived from expansion of a few T cell clones. ZsGreen+ and ZsGreen− CD4+ T cells from spleens of tamoxifen-treated old Lgp130 × CD4CreERT2 mice and from CD4+ cells from spleens of untreated Lgp130 × CD4CreERT2 mice or of Lgp130 mice, serving as controls, were analyzed by flow cytometry for their Vβ TCR repertoire (Fig. 7E, 7F, Supplemental Fig. 4B). CD4+ cells from control mice and ZsGreen− CD4+ T cells from Lgp130 × CD4CreERT2 mice had a largely similar Vβ repertoire. ZsGreen+ CD4+ T cells also presented with a broad repertoire; however, we also detected substantial expansion of T cells with distinct Vβ domains in individual mice, or of the T cell population not covered by our set of anti-Vβ Abs. Thus, ZsGreen+ memory CD4+ T cells are mainly derived from a polyclonal T cell population; however, there is also an indication for the expansion of individual clones, suggesting that these cells had responded to an Ag challenge.
Discussion
Consistent with the central role of the gp130-STAT3 axis in the induction of TH17 cells (1, 2, 5), we observed enhanced TH17 cell differentiation of naive Lgp130+ CD4+ T cells under TH17 cell polarizing in vitro conditions. Lgp130 expression did not result in substantial TH17 cell differentiation under TH0 conditions, indicating that gp130 signaling alone is not sufficient for TH17 cell differentiation. In contrast, Lgp130 was still able to suppress TH1 and Treg cell development under TH1 or Treg cell polarizing conditions, respectively. For Treg cells, this result is consistent with the inhibitory activity of IL-6 and STAT3 in their formation and function (6, 25–27). In line with the in vitro results, both Lgp130 × CD4Cre and Lgp130 × CD4CreERT2 mice showed enhanced frequencies of TH17 cells in the Lgp130+ CD4+ T cell populations, and following S. aureus infection of Lgp130 × CD4CreERT2 mice, large numbers of Lgp130+ TH17 cells but virtually no Lgp130+ Treg cells were found in infected tissues. In contrast, Lgp130 expression did not prevent the formation of LLO189 − 201-specific TH1 cells following L. monocytogenes infection. Overall, these results demonstrate that gp130 signaling sensitizes naive T cells to the induction toward TH17 cells and that it does not effectively prevent the formation of TH1 cells.
gp130 signaling is attenuated by the induction of SOCS family members, particularly SOCS3 (2), and this feedback loop should also limit Lgp130 activity. We observed persistent Lgp130 signaling after transfection of different cell lines with a Lgp130 construct and in mice with transgenic Lgp130 expression in hepatocytes and T cells (12, 14). Thus, under all conditions, JAK-STAT signaling induced by Lgp130 appears to override inhibition by SOCS3.
Lgp130 × CD4Cre mice to a large part phenocopy mice with constitutive expression of a hyperactive STAT3 (STAT3C) in CD4+ T cells (28, 29). STAT3C expression in CD4+ T cells enhances TH17 cell differentiation in vitro, and STAT3C transgenic mice show increased frequencies of TH17 cells. STAT3C transgenic mice also develop severe lung inflammation which can be mitigated with anti–IL-17A Abs. Thus, both studies confirm the central role of the gp130-STAT3 axis in TH17 cell formation. However, STAT3C expression does not impair the formation of Treg cells in vitro, and transgenic mice have normal frequencies of Treg cells that are also functional in suppression assays. The reason for the different impact of Lgp130 and STAT3C on Treg cell differentiation is currently unclear. gp130 signaling is not restricted to the STAT3 pathway, and other signaling pathways originating from gp130 might further affect T cell differentiation. It is also unclear why expression of Lgp130 and STAT3C in T cells causes severe lung inflammation but results in none or only mild symptoms in other tissues. One explanation could be that mice die due to deterioration of lung function before they develop visible symptoms in other tissues. However, it is also possible that Lgp130+ or STAT3C+ T cells react to Ags present in the lung or that the lung tissue is particularly sensitive to cytokines or other factors produced by these T cells. Of note, in a report in the same issue, Rafii et al. also analyze Lgp130 × CD4Cre mice (30). Consistent with our results, they observe a dramatically shortened life span of mice with inflammation of peripheral tissues, including spleen, liver, and heart. Interestingly, they also detect enhanced levels of circulating autoantibodies, including rheumatoid factors, anti-nuclear Abs, and anti-dsDNA Abs. Together with our results, this would indicate that constitutive gp130 signaling in T cells results in a generalized autoimmune phenotype.
After Lgp130 induction, up to 50% of CD4+ T cells of Lgp130 × CD4CreERT2 mice became Lgp130+; however, compared with Lgp130+ T cells from Lgp130 × CD4Cre mice, these CD4+ T cells were less activated, and mice only slowly accumulated TH17 cells and developed severe lung inflammation only after several months. Lgp130 × CD4Cre mice showed a significant reduction of Treg cells in peripheral tissues. In Lgp130 × CD4CreERT2 mice, loss of Treg cells in the Lgp130+ population was also evident in lungs but particularly pronounced in kidneys after S. aureus infection and in tissues of old mice. In contrast, Lgp130 × CD4CreERT2 mice accumulate Treg cells in the Lgp130− CD4+ T cell population. Based on these observations and on published data on the role of IL-6 and STAT3 signaling in Treg cell induction and stability (6, 25–27, 31), we postulate that Lgp130+ induced Treg cells are not generated in sufficient amounts or that thymus-derived Lgp130+ natural Treg cells are unstable in an inflamed environment and thus cannot suppress pathogenic Lgp130+ T cells. In Lgp130 × CD4CreERT2 mice, Lgp130− Treg cells provide suppression, and only in old mice do pathogenic Lgp130+ T cells become dominant and cause tissue damage.
In both mouse strains, Lgp130+ T cells with an activated phenotype and an expanded TH17 cell population accumulated in peripheral tissues, particularly in the lung. In old Lgp130 × CD4CreERT2 mice, Lgp130+ CD4+ T cells showed a broad Vβ repertoire but also expansion of the T cell populations with distinct Vβ-chains in individual mice, arguing that some Lgp130+ T cell clones had expanded in response to Ag. Based on these results, we propose that pathogenic Lgp130+ T cells are either autoreactive or react to environmental Ags in the lung and probably in other tissues. Thus, constitutive gp130 signaling prevents development of peripheral tolerance, and this is likely due to excessive generation of effector T cells, especially of TH17 cells, recognizing environmental or self-antigens, but also to ineffective Treg cell formation.
Within a few weeks after induction, Lgp130+ CD4+ T cells in Lgp130 × CD4CreERT2 mice acquire a uniform CD44+ memory phenotype. The Lgp130+ T cell population slowly increases in peripheral blood and after 1 y represents most CD4+ T cells in most analyzed tissues. Lgp130+ T cells still comprise a large RORγt+ TH17 cell population, and a substantial proportion of cells present a CD45iv−CD69+ tissue-resident memory T cell phenotype. The expansion and long-term maintenance of Lgp130+ T cells could be due to a continuous response to a persisting environmental Ag or autoantigen. However, we also cannot exclude that gp130 signaling promotes long-term survival of T cells independent of Ag stimulation. Constitutive expression of Lgp130 in the B cell lineage or in all hematopoietic cells induces B cell lymphomas with high penetrance (13, 32). Although Lgp130 × CD4CreERT2 mice had a large population of Lgp130+ T cells after induction, we did not observe lymphoma development in these mice. In addition, although some Vβ elements were enriched in Lgp130+ T cells from old mice, T cells still presented with a broad Vβ repertoire. Thus, we failed to detect one or few dominant Vβ elements, which should be expected for T cell lymphomas. Overall our results indicate that cell-autonomous gp130 signaling enhances memory T cell formation and survival but does not promote lymphoma formation in T cells.
In conclusion, we demonstrate that cell-intrinsic gp130 signaling in T cells has a significant impact on their differentiation and function, with accumulation of highly activated T cells in peripheral tissues and damage of the tissues as fatal consequences. Thus, it is essential that gp130 signaling is strictly controlled in these cells.
Disclosures
The authors have no financial conflicts of interest.
Acknowledgments
We thank Dr. F. Koch-Nolte, Dr. S. Krasemann, Dr. U. Panzer, Dr. J. Ruland, Dr. T. Buch, Dr. Gisa Tiegs, Carsten Rothkegel, and A. Peters for providing mouse lines and materials and for technical support.
Footnotes
This work was supported by the Deutsche Forschungsgemeinschaft Grant CRC 841 to S.H., D.S.-A., S.R.-J., and H.-W.M.
The online version of this article contains supplemental material.
